The post Philippines Footprint Report: <br>A look at Northern Mindanao appeared first on Global Footprint Network.
]]> Global Footprint Network collaborated with the Philippine government and the Agence Française de Developpement (AFD) to undertake a study of the Northern Mindanao/Bukidnon river basin region to understand the benefits of integrating Ecological Footprint and biocapacity frameworks into climate resilient land use and local development planning.
The third phase of a multi-year project, the Northern Mindanao Ecological Footprint Report presents a baseline analysis of Ecological Footprint and biocapacity to inform future policies in the region by identifying critical ecological pressures and drivers. The report also provides data, analysis, and information to policymakers to strengthen sustainability regulation efforts and guide effective development efforts.
Specifically, the report takes a deeper look at the Footprint outcomes of AFD’s “Reviving Ecosystems Nature and Agriculture by Implementing Sustainable Solutions And Community Empowerment” (RENAISSANCE) Project. The RENAISSANCE Project sets ambitious goals related to such issues as agricultural production and agribusiness to ensure the long-term social and economic viability of Northern Mindanao.
The report also makes policy recommendations for local agencies and relevant land use and climate change action plans, which were summarized and distributed to key decision makers in the Bukidnon Province.
Results
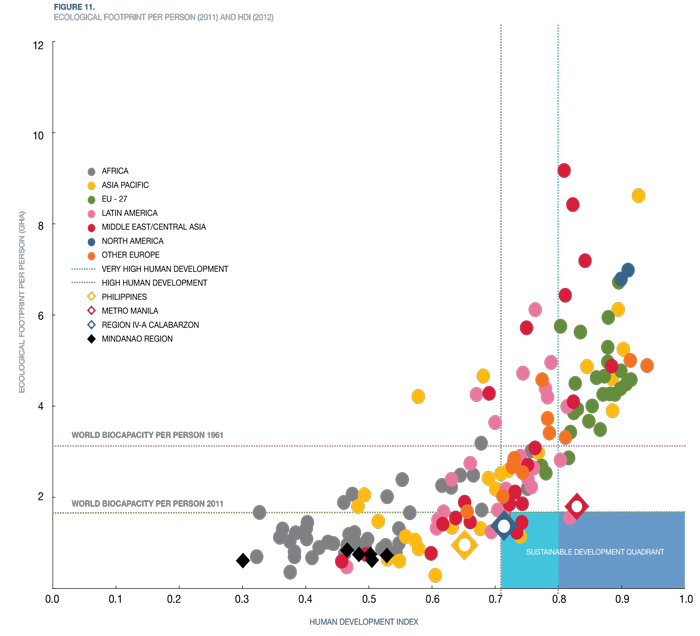
Since 1970, the Philippines per person Ecological Footprint has risen only slightly, while at the same time the country has made steady gains in its Human Development Index score. While the Human Development Index shows that the average resident has achieved higher levels of development, the Philippines Gini coefficient—an indicator of income disparity—is the highest of counties in Southeast Asia. Average measures of development may not reflect segments of the population that do not have access to resources required to meet basic needs such as food, shelter, health, and sanitation.
Cropland area in Bukidnon has expanded by almost 30%, resulting in a 17% increase in cropland biocapacity since 2000, but forest land biocapacity has been steadily decreasing, revealing the impact of land conversion.
Additional Resources
Philippines 2013 Ecological Footprint Report: Restoring Balance in Laguna Lake Region
Ecological Footprint of the Philippines Report: A Measure for Resilience
The post Philippines Footprint Report: <br>A look at Northern Mindanao appeared first on Global Footprint Network.
]]>The post El Poder Ecológico: Our Colombian partnership to advance sustainability appeared first on Global Footprint Network.
]]>After decades of civil war, peace agreements between the Colombian government and the FARC (recently renamed Common Alternative Revolutionary Force) have opened up new possibilities, and Nariño is eager to build a new future based on their strengths, including its ecological advantages. Under the leadership of Gov. Camilo Romero Galeano (who is also Colombia’s Green Alliance Party co-president), Nariño is positioned to be at the forefront of a new green economy in Colombia.
The subsecretary of Environmental Management and Green Growth of Nariño, Ricardo Mora, reached out to Global Footprint Network for technical support about using the Ecological Footprint and other sustainability metrics to advance strategic initiatives in the Nariño province. Global Footprint Network staff are working in close partnership with Nariño representatives to help them capitalize on the momentum of these historic events.
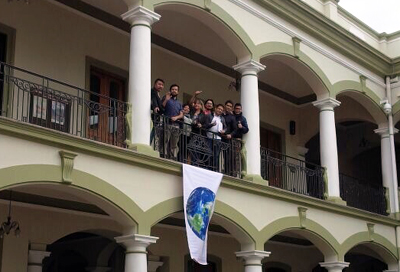 On Earth Overshoot Day, the Secretariat of Environment and Sustainable Development in Nariño, Ramiro Estacio, joined us along with organizations around the world to call for the reduction of indiscriminate use of natural resources. Mora also underscored our joint efforts, saying, “[the MOU with Global Footprint Network] isn’t simply to carry out scientific studies on Nariño’s Ecological Footprint and biocapacity, but also to direct our province with concrete actions on how to build a green economy that takes ecological limits into account and move back the date of Earth Overshoot Day, so that our actions with natural resources in the region are sustainable.” Our Nariño colleagues also hung a banner of the Earth in honor of Overshoot Day (pictured right).
Just a month earlier, Mora and Dr. Ivan Felipe Benavides, scientific adviser for the Environment and Sustainable Development Office at Nariño, spent two weeks in our Oakland offices participating in lectures, exercises, and discussion, starting with underlying major concepts of sustainability and their critical role as part of larger frameworks for monitoring and achieving societal well-being.
Natural scientists by training, Mora and Benavides quickly drilled down to the scientific theory and technical details of sub-national Ecological Footprint assessments, including National Footprint Accounts, input-output analysis, and bottom up-top down approaches to Footprint accounting. By the end, our colleagues had developed a game plan to apply a sustainability monitoring framework for the transformation of Nariño to a green economy.
“The math and the essentials of the Ecological Footprint are very simple to understand, and the calculations very straightforward. It’s all about understanding that the capacity of our planet to produce ecological assets (biocapacity) does not have an infinite growth as our current economic system seems to assume, but its rather a cycle with spatial and temporal limits,” said Benavides. “However our greater challenge is to take this information available to our people and translate it into strategic actions to live well, within these limits. We want people in Nariño to live great lives with the big ecological power that we have.”
During their stay, Mora and Benavides also taught us much about their work laying a foundation for a thriving green economy, and of Nariño’s incredible natural wealth. Located in southwestern Colombia, their province has extraordinary natural beauty and is a biological hot spot–home to more than 5,000 species of plants and animals. Over the next year of partnership, we will deepen our collaboration, including Global Footprint Network staff supporting Nariño staff on the ground, where we will also be able to witness the beauty of the province first hand, as well as the inspiring transformation of a war-torn region into a leading green economy.
The post El Poder Ecológico: Our Colombian partnership to advance sustainability appeared first on Global Footprint Network.
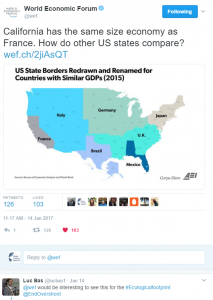
]]>The post California has the same size Ecological Footprint as France. How do other states and countries compare? appeared first on Global Footprint Network.
]]>Our map was inspired by a similar one for GDP posted on Twitter by the World Economic Forum (WEF) during its 2017 Annual Meeting in Davos earlier this month. The original graphic was posted by the American Enterprise Institute last year.
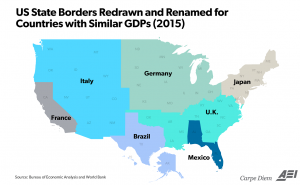
As WEF noted on its blog, seven areas of the US have the same GDP as entire countries. We were very surprised that the Ecological Footprints of these same seven countries also have approximately the same Ecological Footprint of the entire United States, although our map is different from the GDP map in a few striking ways.
First, it’s notable that the total US Ecological Footprint equals that of seven countries that together generate the same GDP as the US. It’s especially remarkable considering that combined populations of these seven countries—approximately 730 million (UN FAO)—is more than double the 320 million people who live in the United States. This reflects the substantially higher average Ecological Footprint per person of Americans compared with other countries. For instance, the Ecological Footprint per person for the US is 8.6 global hectares (gha), more than double Brazil’s Footprint average of 3.1 gha and Mexico’s average of 2.6 gha.
Germany’s Ecological Footprint per person comes closest to that of the United States, and it’s still substantially lower, at 5.3 gha.
In the WEF/American Enterprise map, some US states have GDPs the size of countries. This also holds true for just California and France in the Footprint map.
The maps show that California and France have roughly the same GDP and Footprint. Yet California’s population totals approximately 37 million, compared with France’s 64 million. California, thus, comes out as a more powerful economic engine than France on a per-person basis, but at a cost to sustainability. California’s 2015 per person Footprint, updated from our State of the States report with our latest methodology, totaled 21.2 acres per person, or nearly 8.6 global hectares per person, compared with France’s 4.8 gha.
Meanwhile, Brazil’s GDP equates that of Texas, but its Ecological Footprint expands beyond Texas’ borders on our map to include nine other states. This likely reflects Brazil’s larger population—the two factors that drive Ecological Footprint are consumption and population. Brazil’s population totals 208 million, compared with Texas’ population of 25 million. Here, Texas comes out as the economic powerhouse, while Brazil earns points for lower resource consumption.
Similarly, Mexico’s economy equates that of only two states—Florida and Alabama—while its Ecological Footprint totals the Footprints of those two states plus Georgia and Mississippi.
The situation in Germany is just the opposite. Its economy covers twice as many states on the GDP map as those covered on the Footprint map.
To be sure, the maps can be a bit confusing. The WEF map makes it look like the economy of Italy is bigger than that of France, because Italy covers more states. But those states have smaller economies combined than all of California, one of the 10th largest economies in the world.
And on our Footprint map, it appears Brazil has a much larger Footprint than Japan. Japan’s Footprint and economy maps over the northeastern states, including New York. But in fact, Brazil and Japan have relatively similar total Ecological Footprints—approximately 625 million for Brazil and 600 million for Japan.
Maybe the next step to improve clarity would be to create anamorphic maps in which the size of the states are adjusted to reflect the size of their economies and Ecological Footprints. Anyone up for that challenge?
A special call out to Luc Bas, Director of the Brussels office of the International Union for Conservation of Nature (IUCN), for suggesting we create this map in his Tweet below.
The post California has the same size Ecological Footprint as France. How do other states and countries compare? appeared first on Global Footprint Network.
]]>The post North Rhine-Westphalia releases Ecological Footprint analysis appeared first on Global Footprint Network.
]]> If the global population lived like citizens of North Rhine-Westphalia (NRW), we would need 3.3 Earths, according to a report presented by the German state’s environmental minister in a press conference in Düsseldorf in December.
The Ecological Footprint was the headline indicator of the Fourth NRW Environmental Report, presented by NRW Environment Minister Johannes Remmel and widely covered by German media, including WDR, Westdeutsche Zeitung, and SAT.1 NRW (video). The report also was distributed to members of the state parliament and cabinet.
“Wir üben eine Herrschaft über künftige Generationen aus, die nicht mehr über ihre Ressourcen entscheiden können,” Minister Remmel said. (English translation: “We are reigning over future generations that can no longer decide about their resources.”)
The report contains the first Ecological Footprint analysis of the most populous German state and finds that North-Rhine Westphalia needs more than five times the amount of resources than its own ecosystems are able to renew.
“If we consume more than what nature can renew, it leads inevitably to over-exploitation and ecological deterioration, ultimately undermining our economies’ ability to operate,” notes Mathis Wackernagel, co-founder and CEO of Global Footprint Network. An essay by Wackernagel opened the report, which also featured the Ecological Footprint assessment in addition to nearly 30 other environmental indicators.
With an Ecological Footprint of 5.8 global hectares (gha) per person, the people of North Rhine-Westphalia demand on average about 9 percent more from nature than the German citizen, according to the report. The global average Ecological Footprint is 2.8 gha per person. But there are only 1.7 global hectares available per person worldwide.
Carbon emissions are a large driver of the region’s high Ecological Footprint. CO2 emissions average 10 tonnes per person in Germany and 16 tonnes in NRW. By comparison, carbon emissions in India average 1.5 tonnes per person per year.
North-Rhine Westphalia performs similarly to the German federal average in all aspects of consumption – with the exception of energy use. The reason for its large Footprint and less favorable results when compared with Germany overall is, in particular, the energy mix in North-Rhine Westphalia, or more specifically its carbon intensity of electricity. Electricity in North-Rhine Westphalia is often generated with carbon intensive lignite and stone coal.
Minister Remmel therefore called for an orderly exit from the coal industry.
In a press release, Minister Remmel added, “Allein diese Zahlen zeigen, dass wir die Ressourcensicherheit ernst nehmen sollten. Wir leben von der Substanz, die wir eigentlich unseren Kindern und Enkelkinder hinterlassen sollten. Wir müssen daher den Ressourcen-Verbrauch eindämmen, unter anderem durch die Entwicklung neuer effizienterer Technologien. Aber auch jede und jeder Einzelne kann dazu beitragen, dass Nordrhein-Westfalen dauerhaft zu einem besseren Ort mit vorbildlicher Umwelt- und Lebensqualität wird.”
(English translation: “These figures alone show that we should take resource security seriously, and we are living on the principal rather than the income of nature. We are reducing the substance that we should actually leave our children and grandchildren. We need to curb resource consumption, including by developing new, more efficient technologies. Each and every individual can help make North Rhine-Westphalia a better place with exemplary and lasting environmental and life quality.”)


Report:
English chapter
Full report (in German)
The post North Rhine-Westphalia releases Ecological Footprint analysis appeared first on Global Footprint Network.
]]>The post State of the States Report appeared first on Global Footprint Network.
]]>A Twitter chat on the report was hosted on July 14, 2015, at #USAfootprint. To view the Twitter chat, go here.
“State of the States” details the Ecological Footprint and resource availability of the 50 states and the District of Columbia. The report finds that resource consumption and availability varies dramatically state by state.
Highlights from the report include:
- The population of the United States is using twice the renewable natural resources and services that can be regenerated within its borders.
- The states with the largest per-person Ecological Footprints are Virginia, Maryland, and Delaware.
- The states with the smallest per-person Ecological Footprints are New York, Idaho, and Arkansas.
- Alaska, Texas, and Michigan are the most resource-abundant states based on biocapacity, a measure of bioproductive land.
- The states with the least biocapacity are Rhode Island, Delaware, and Arizona.
- California, Texas, and Florida have the highest ecological deficits.
- Alaska, South Dakota, and Montana have the greatest ecological reserves.
Additional Resources
Press Release: Today is the Ecological Deficit Day for the United States
Ecological Wealth of the 50 States
| State | Population | Gross Domestic Product, 2014 | Life Expectancy at Birth | Human Development Index | Carbon Footprint | Non-carbon Footprint | Total Ecological Footprint | Biocapacity |
|---|---|---|---|---|---|---|---|---|
| (millions) | (chained 2009 dollars per capita) | (years) | (global acres per person) | (global acres per person) | (global acres per person) | (global acres per person) | ||
| 310,384,000 | 49,469 | 78.9 | 5.03 | 11.5 | 5.7 | 17.2 | 9.3 | |
| 4,779,736 | 37,593 | 75.4 | 4.04 | 11.2 | 5.1 | 16.3 | 14.8Ala | |
| 710,231 | 66,160 | 78.3 | 5.06 | 13.1 | 6.2 | 19.2 | 510.9 | |
| 6,392,017 | 38,743 | 79.6 | 4.89 | 10.3 | 5.4 | 15.8 | 1.1 | |
| 2,915,918 | 37,334 | 76.0 | 3.91 | 10.6 | 4.8 | 15.4 | 24.8 | |
| 37,253,956 | 54,462 | 80.8 | 5.40 | 10.5 | 6.0 | 16.5 | 1.9 | |
| 5,029,196 | 52,214 | 80.0 | 5.53 | 13.4 | 6.6 | 20.0 | 5.8 | |
| 3,574,097 | 64,676 | 80.8 | 6.17 | 13.7 | 7.8 | 21.5 | 2.0 | |
| 897,934 | 60,551 | 78.4 | 5.22 | 16.6 | 6.8 | 23.4 | 3.4 | |
| 601,723 | 159,386 | 76.5 | 6.08 | 15.8 | 6.3 | 22.0 | 0.2 | |
| 18,801,310 | 38,690 | 79.4 | 4.82 | 10.9 | 5.2 | 16.0 | 4.6 | |
| 9,687,653 | 43,131 | 77.2 | 4.62 | 11.6 | 5.4 | 17.0 | 8.2 | |
| 1,360,301 | 49,686 | 81.3 | 5.53 | 11.3 | 5.8 | 17.1 | - | |
| 1,567,582 | 35,235 | 79.5 | 4.50 | 9.5 | 5.8 | 15.3 | 17.0 | |
| 12,830,632 | 52,827 | 79.0 | 5.31 | 11.3 | 5.8 | 17.2 | 5.9 | |
| 6,483,802 | 43,861 | 77.6 | 4.56 | 13.1 | 6.0 | 19.1 | 7.7 | |
| 3,046,355 | 49,075 | 79.7 | 5.03 | 13.9 | 6.6 | 20.5 | 21.0 | |
| 2,853,118 | 45,765 | 78.7 | 4.96 | 13.1 | 6.0 | 19.1 | 26.2 | |
| 4,339,367 | 38,938 | 76.0 | 4.02 | 14.2 | 5.3 | 19.5 | 13.9 | |
| 4,533,372 | 46,448 | 75.7 | 4.12 | 12.0 | 5.3 | 17.3 | 13.1 | |
| 1,328,361 | 38,327 | 79.2 | 4.93 | 10.1 | 5.7 | 15.8 | 30.5 | |
| 5,773,552 | 53,759 | 78.8 | 5.94 | 16.9 | 7.4 | 24.3 | 2.5 | |
| 6,547,629 | 63,005 | 80.5 | 6.16 | 12.0 | 6.6 | 18.6 | 1.7 | |
| 9,883,640 | 42,110 | 78.2 | 4.76 | 11.2 | 5.5 | 16.6 | 11.8 | |
| 5,303,925 | 52,801 | 81.1 | 5.69 | 12.4 | 6.4 | 18.8 | 16.9 | |
| 2,967,297 | 31,551 | 75.0 | 3.81 | 10.7 | 4.9 | 15.6 | 21.7 | |
| 5,988,927 | 42,854 | 77.5 | 4.60 | 13.4 | 6.1 | 19.5 | 16.2 | |
| 989,415 | 38,539 | 78.5 | 4.54 | 10.9 | 5.2 | 16.1 | 54.3 | |
| 1,826,341 | 52,724 | 79.8 | 5.11 | 13.5 | 6.7 | 20.3 | 38.1 | |
| 2,700,551 | 42,539 | 78.1 | 4.63 | 11.8 | 6.4 | 18.2 | 4.1 | |
| 1,316,470 | 49,951 | 80.3 | 5.73 | 13.6 | 7.8 | 21.4 | 8.8 | |
| 8,791,894 | 56,405 | 80.3 | 6.12 | 11.9 | 6.8 | 18.7 | 1.3 | |
| 2,059,179 | 40,081 | 78.4 | 4.52 | 11.3 | 5.5 | 16.8 | 11.9 | |
| 19,378,102 | 64,818 | 80.5 | 5.66 | 9.3 | 5.0 | 14.2 | 3.5 | |
| 9,535,483 | 44,281 | 77.8 | 4.57 | 12.2 | 5.4 | 17.6 | 7.6 | |
| 672,591 | 65,225 | 79.5 | 4.90 | 15.2 | 6.7 | 22.0 | 38.5 | |
| 11,536,504 | 45,887 | 77.8 | 4.71 | 12.4 | 5.8 | 18.3 | 5.5 | |
| 3,751,351 | 41,871 | 75.9 | 4.14 | 13.4 | 5.6 | 19.1 | 20.2 | |
| 3,831,074 | 51,329 | 79.5 | 4.86 | 9.8 | 5.9 | 15.7 | 17.4 | |
| 12,702,379 | 47,637 | 78.5 | 5.07 | 10.4 | 5.4 | 15.8 | 4.9 | |
| 1,052,567 | 47,901 | 79.9 | 5.38 | 11.4 | 6.2 | 17.5 | 1.5 | |
| 4,625,364 | 36,125 | 77.0 | 4.35 | 10.7 | 5.2 | 16.0 | 9.3 | |
| 814,180 | 46,688 | 79.5 | 4.79 | 11.2 | 6.1 | 17.3 | 72.3 | |
| 6,346,105 | 42,115 | 76.3 | 4.22 | 11.3 | 5.0 | 16.3 | 9.9 | |
| 25,145,561 | 54,433 | 78.5 | 4.65 | 12.8 | 5.8 | 18.6 | 6.7 | |
| 2,763,885 | 43,555 | 80.2 | 5.03 | 14.8 | 7.1 | 22.0 | 5.0 | |
| 625,741 | 43,354 | 80.5 | 5.31 | 10.2 | 6.5 | 16.7 | 19.5 | |
| 8,001,024 | 51,338 | 79.0 | 5.47 | 17.0 | 7.7 | 24.6 | 7.4 | |
| 6,724,540 | 55,298 | 79.9 | 5.40 | 10.6 | 6.3 | 17.0 | 10.6 | |
| 1,852,994 | 36,769 | 75.4 | 3.95 | 13.9 | 5.3 | 19.2 | 19.4 | |
| 5,686,986 | 46,665 | 80.0 | 5.16 | 12.9 | 6.3 | 19.2 | 14.1 | |
| 563,626 | 64,309 | 78.3 | 4.83 | 13.9 | 6.5 | 20.4 | 39.8 |
Data Table References
Population: 2010 U.S. Census
GDP, 2014: U.S. Bureau of Economic Analysis
Life Expectancy at Birth: Measure of America Human Development Index (HDI) and Supplemental Indicators 2013–2014
Human Development Index: Measure of America Human Development Index (HDI) and Supplemental Indicators 2013–2014. The American HDI is a composite measure of health, education, and income indices.
The post State of the States Report appeared first on Global Footprint Network.
]]>